Share Buybacks: What They Are, Why They Happen, and How to Read Them
When a company has more cash than it can productively reinvest, it has a handful of ways to return it to shareholders. Dividends are the obvious one. The other, less understood, is the share buyback — the company using its own money to purchase its own stock on the open market. In 2026 buybacks are everywhere: Salesforce ran a $25 billion accelerated repurchase, NVIDIA authorized $80 billion more, Ferrari is grinding through a €3.5 billion multi-year program. The headlines make them sound uniformly bullish.
They are not. A buyback is a capital-allocation decision, and like any such decision it can be brilliant or value-destructive depending on the price paid, how it’s funded, and why management chose it over the alternatives. The same word covers Berkshire buying its own stock only when it trades below intrinsic value, and a company issuing debt to prop up a falling share price.
This post explains what a buyback actually is, the mechanics behind it, the genuine benefits it brings to a business and its owners, and — most importantly — how to tell the healthy ones from the ones that should make you cautious.
What it is
A share buyback (or share repurchase) is a transaction in which a publicly traded company uses its own cash to buy shares of its own stock back from the market. Those shares are either cancelled outright or held in “treasury,” where they no longer count as outstanding. The effect is mechanical: fewer shares exist, so each remaining share represents a slightly larger claim on the same company.
It is one of two main ways to return capital to shareholders, the other being dividends. The key conceptual difference: a dividend hands you cash directly and is taxable as income in most jurisdictions; a buyback raises the value of each share you already hold by shrinking the share count, with no cash changing hands in your account and — in many tax systems — no immediate tax event. The buyback is not charity to shareholders or a favor to the stock price. It is management spending the company’s money, and the only question that matters is whether that money was spent well.
Why it matters
A buyback announcement of “$X billion” does not mean the company will spend that amount, and it almost never means it will buy at a fixed price. It is an authorization — board permission to spend up to a ceiling, executed over time at prevailing market prices, when management chooses. Understanding the benefits and the incentives behind that authorization is what separates a useful signal from noise.
The genuine benefits, when a buyback is done well:
-
Higher earnings per share, mechanically. Spread the same net income across fewer shares and EPS rises, even if total profit is flat. This is real — but it is the double-edged one: the very same mechanism can flatter a stalling business, which is why it reappears as a warning in the Tradeoffs section below. A buyback that lifts EPS while the underlying business goes nowhere is not creating value, only redistributing the optics.
-
A tax-efficient return of capital. For the shareholder, a buyback converts a potential dividend (taxed as income) into a capital gain realized only when you choose to sell. In a no-capital-gains jurisdiction like Switzerland, this is structurally favorable — buyback-driven appreciation is untaxed, where the same company’s dividend would be taxed as income.
-
A credible signal — sometimes. When management buys stock only below its estimate of intrinsic value, the act itself is information: insiders, who know the business best, are saying it’s cheap. Berkshire Hathaway operates exactly this way, repurchasing only when the price falls below a conservative intrinsic-value estimate. When Greg Abel resumed Berkshire’s buyback in March 2026 after 21 months of doing nothing, the resumption itself was the signal.
-
Flexibility over dividends. A dividend cut is punished brutally by the market, so dividends are a near-permanent commitment. A buyback can be paused in a downturn with no such stigma, giving management a more flexible tool for returning excess cash.
How it works
The mechanism depends on the type of buyback, but the most common — the open-market repurchase — works like this. The board authorizes a maximum dollar amount with no fixed expiration. The company then buys shares on the open market over months or years, typically through pre-arranged plans (so-called 10b5-1 programs in the US, or independent broker mandates in Europe) that execute automatically within set parameters. Crucially, there is no announced target price — the company pays whatever the market price is on the day it buys.
This is why the question “at what price did they buy?” usually has no single answer. The purchase price is simply the market price across all the days the company was buying. Ferrari’s filings illustrate this concretely: between 5 January and 10 June 2026 it purchased 1,339,241 of its own shares for roughly €392.5 million, an average of about €293 per share — but that average spans dozens of trading days at dozens of different prices, including the weeks when the stock fell after the divisive “Elettrica” launch. (Ferrari SEC 6-K, 11 June 2026)
The open-market program is the common case, but it isn’t the only one. Two others matter. An accelerated share repurchase (ASR) is when a company pays an investment bank a large sum up front and receives most of the shares immediately, with the final price settled later against the average market price over the program — it’s how a firm retires a big block in one move rather than dribbling buys over months (Salesforce’s $25 billion program below is an ASR). A tender offer is the one case where there is a fixed price: the company offers to buy a set number of shares at a stated price for a limited window, and shareholders choose whether to sell in. Tender offers are comparatively rare; the open-market repurchase dominates.
One more wrinkle, specific to US companies since 2023: the Inflation Reduction Act imposes a 1% excise tax on net buybacks (repurchases minus new issuance). It’s small, but it’s a real cost at the company level and it slightly narrows the historic tax advantage buybacks held over dividends — worth remembering whenever someone frames buybacks as purely tax-free.
Once repurchased, shares sit in treasury until cancelled. Cancellation is the step that makes the reduction permanent: Ferrari held about 9.5% of its capital in treasury by late May 2026, and its April 2026 AGM approved cancelling part of it. (Ferrari SEC 6-K, 25 May 2026) Until shares are cancelled, they can theoretically be reissued — which matters, because a company that buys back stock and then re-issues it to employees isn’t shrinking the share count at all.
In practice
The same word, “buyback,” describes wildly different situations. Five companies from 2026 — plus one telling counter-example — show the range, with figures drawn from their own filings and disclosures.
Mastercard — the disciplined compounder. In December 2025 the board approved a new $14 billion authorization, to start once the prior $12 billion program completes, alongside a 14% dividend increase. (Mastercard, 9 Dec 2025) This is routine, healthy capital return from a business with very high margins and predictable cash flow. The buyback here is a feature of quality, not a special signal.
Ferrari — the steady, self-funded reducer. A ~€3.5 billion multi-year program through 2030, executed in €250 million tranches at a measured ~1% of capital per year, funded entirely from cash, not debt. It kept buying through the post-Elettrica dip — exactly the behavior a systematic program is designed for.
Berkshire Hathaway — the value-gated buyer. Resumed in March 2026 after 21 months, and deliberately small (~$234 million against a ~$397 billion cash pile). The point isn’t the size; it’s that Berkshire only buys below intrinsic value, so the resumption was a statement that the stock had finally entered its “cheap” zone.
NVIDIA — the maturity signal. On 18 May 2026 the board approved an additional $80 billion authorization on top of $38.5 billion remaining, for ~$118 billion of no-expiration capacity, alongside a dividend raised from $0.01 to $0.25 per share. (NVIDIA Q1 FY27 8-K, SEC) An enormous program like this, from a company still growing revenue 85% year-over-year, says as much “we have more cash than we can reinvest” as it says “our stock is cheap” — a subtle shift toward the capital-return profile of a maturing company.
Salesforce — the leveraged, defensive case. A $25 billion accelerated share repurchase (ASR) in its May 2026 quarter, retiring ~103 million shares (about 10% of the float) upfront — but funded by issuing roughly $24.8 billion of new debt, with non-current debt jumping from about $10.4 billion to $39.3 billion. (Salesforce Q1 FY27 results) Borrowing to buy back a stock that was down 43% year-to-date is the most aggressive and most questionable kind of buyback: if the price keeps falling, the company has destroyed value by buying high with borrowed money.
And the counter-example worth knowing: Amazon. Its only program, a $10 billion authorization from March 2022, still had $6.1 billion unspent as of late 2025, with the filings stating plainly there were “no repurchases of our common stock” throughout 2024 and 2025. Meanwhile its share count rose (about 10.8 billion shares including stock awards by year-end 2025) because of stock-based compensation. (Amazon 10-K FY2025, SEC; Amazon 10-Q Q3 2025, SEC) Amazon simply prefers to reinvest — $128 billion in capex in 2025 — so any thesis that “buybacks support the price” doesn’t apply to it at all.
How it compares
Buybacks and dividends are the two routes for returning capital, and they suit different situations. A fair comparison:
| Dimension | Buyback | Dividend |
|---|---|---|
| Cash to shareholder | None directly; value lifts via lower share count | Direct cash payment |
| Taxation (typical) | Deferred — capital gain realized only when you sell | Taxed as income when paid |
| Flexibility | Easy to pause, no stigma | Cutting is punished severely |
| Signal quality | Strong only if bought below intrinsic value | Steady dividend signals stable cash flow |
| Main risk | Buying overvalued stock destroys value | Over-committing cash the business may later need |
Neither is inherently superior. A dividend is the better fit for a shareholder who wants income and for a business with stable, mature cash flows. A buyback is the better fit when the stock is genuinely undervalued and the shareholder benefits from tax deferral. The abuse case for each is different: dividends can be over-committed; buybacks can be executed at the wrong price. One caveat on the tax row: the buyback’s edge is real but jurisdiction-dependent — large in a no-capital-gains system like Switzerland, smaller for a US investor in a taxable account, and narrowed further by the 1% US excise tax on the company side. It is a tilt, not a free lunch.
Tradeoffs
The honest cons — the reasons a buyback is not automatically good for investors:
-
Price discipline is everything, and often absent. A buyback only creates value if shares are bought below intrinsic value. Management teams are notoriously bad at this, tending to buy aggressively at market highs (when cash is plentiful) and stop during crashes (when shares are actually cheap) — the exact opposite of value creation.
-
It can mask, rather than reduce, dilution. If a company buys back stock while issuing comparable amounts to employees, the share count doesn’t fall. Amazon is the clean example: real buyback spending, rising share count.
-
Debt-funded buybacks add risk. Borrowing to repurchase shares — Salesforce’s 2026 ASR — levers up the balance sheet to support a per-share metric. If the stock keeps falling or rates bite, the company has taken on permanent debt for a temporary cosmetic effect.
-
EPS flattery. A shrinking share count lifts EPS even when the underlying business is flat or deteriorating. An investor who looks only at per-share growth can be fooled into seeing strength that isn’t there.
-
Opportunity cost. Every dollar spent on a buyback is a dollar not spent on R&D, acquisitions, or debt reduction. For a company with high-return reinvestment opportunities — Amazon’s stance — not buying back is the wiser choice.
A decade in numbers
The cleanest way to see whether buybacks created value for the investor is not a price chart. A stock’s ten-year price move is dominated by earnings, sentiment, and the AI cycle — buybacks are a rounding error inside it. NVIDIA’s price rose enormously despite its buyback being trivial relative to its size; Salesforce’s price fell in 2026 despite a $25 billion repurchase. A price chart placed next to buyback news invites a causal story the data doesn’t support.
The metric that actually isolates the buyback effect is the share count over time. A buyback’s whole job is to shrink the number of shares so each remaining one owns a bigger slice. So the honest test is simple: did the share count actually fall? Four of the companies above, over roughly a decade, tell four different stories. (Ferrari and Berkshire are left out of this chart on purpose: Ferrari’s decade-long, self-funded reduction simply mirrors Mastercard’s, and Berkshire’s dual A/B share structure makes a clean single-line share count misleading.)
| Company | Shares outstanding ~2015 | Shares outstanding ~2025 | Change | Net effect on EPS | Verdict |
|---|---|---|---|---|---|
| Mastercard | ~1.13B | ~0.91B | −20% | +25% | Value created — steady, self-funded reduction |
| NVIDIA (split-adj.) | ~24.9B | ~24.4B | ~−2% | +2% | Minimal — buybacks barely offset stock comp |
| Amazon | ~9.5B | ~10.8B | +14% | −12% | Value diluted — reinvests instead of reducing |
| Salesforce | ~0.66B | ~0.96B | +45% | −31% | Value diluted — count rose despite buybacks |
Three honest caveats about that last column, because the precision is easy to overstate:
First, it measures the net change in share count — buybacks minus new shares issued for stock-based compensation and acquisitions. So a negative number isn’t purely “a bad buyback.” Amazon’s −12% is mostly stock-based compensation diluting holders while the buyback sat idle; Salesforce’s −31% is buybacks being outrun by shares issued for pay and deals. The column answers “did your slice of earnings grow or shrink?”, which is what you ultimately care about — but it’s net share count, not the buyback in isolation.
Second, the math assumes total profit held constant — it isolates the arithmetic of fewer (or more) shares. In reality earnings also grew, so Mastercard’s actual EPS rose far more than 25%; the +25% is only the slice attributable to the shrinking count, holding everything else equal. It’s the buyback’s contribution, not the whole EPS story.
Third, the ~2015 base figures are order-of-magnitude from aggregated data sources rather than line-by-line from each year’s 10-K, so the percentages are approximate — the direction and rough scale are reliable, the second decimal is not.
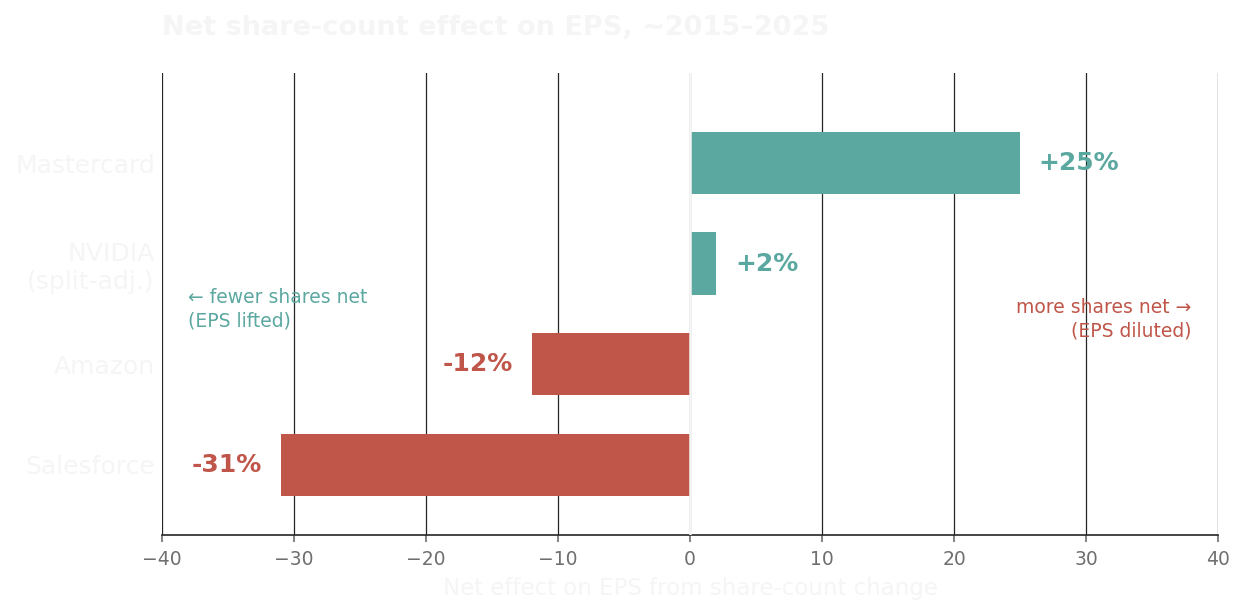
Net share-count effect on EPS, ~2015 to ~2025. Teal = the net share count fell (buybacks outran issuance), raising earnings per share; red = issuance from stock comp and deals outran buybacks, lowering it. NVIDIA is split-adjusted for its June 2024 10-for-1 split. Figures are approximate; see the table above and Sources.
The contrast is the whole lesson. Mastercard did what a buyback is supposed to do — roughly a fifth of the company retired over a decade, funded from its own cash flow, so a 2015 shareholder who never bought another share now owns a meaningfully larger slice. NVIDIA, despite headline-grabbing multi-billion authorizations, barely moved its split-adjusted count: the repurchases mostly offset shares issued to employees, so the net reduction is small — the buyback is real but its per-share benefit is modest. Salesforce is the cautionary case: even with large buybacks, its share count rose ~45% over the decade because stock-based compensation and acquisition-funded share issuance outran the repurchases; only the 2026 debt-funded ASR has begun to reverse it. Amazon never meaningfully reduced its count at all — its share count rose with stock comp while the buyback authorization sat largely unused.
A note on method, in fairness: share-count change isn’t a complete scorecard either. A company can issue shares for a value-creating acquisition, and dilution from stock comp can coincide with a business compounding fast enough that shareholders still do well (NVIDIA’s holders were not harmed by a flat share count when the stock multiplied). The point is narrower and honest: this metric isolates what the buyback itself did to your ownership slice, which a price chart cannot.
Takeaway
A buyback is a tool, not a verdict. The announcement size tells you almost nothing; the why, the how it’s funded, and the price paid tell you almost everything.
The reassuring signals: the company buys below a credible intrinsic-value estimate (Berkshire), funds repurchases from free cash flow rather than debt (Ferrari, Mastercard), and actually cancels shares so the float falls permanently. A value-gated, self-funded, share-reducing program from a high-margin business is the genuinely good kind.
The warning signals: buying at all-time highs, funding with new debt (Salesforce’s leveraged ASR), a rising share count despite “buybacks” (Amazon’s dilution masking), or a buyback that looks like it exists mainly to flatter EPS while the business stalls. And the subtle one — a massive program from a still-fast-growing company (NVIDIA) can quietly signal that management has run out of better things to do with the cash.
The one thing to remember: don’t read “buyback” as “bullish.” Read it as “management is spending the company’s money on its own stock,” then ask whether they’re buying cheap or expensive, with their own cash or borrowed money. The answer to those two questions is the whole story.
Sources
- Ferrari N.V. SEC Form 6-K, buyback periodic reports, 11 June 2026 and 25 May 2026
- Mastercard, $14 billion repurchase authorization, 9 Dec 2025
- Salesforce, Q1 FY27 results coverage
- Amazon buyback status: 10-K FY2025, SEC and 10-Q Q3 2025, SEC
- NVIDIA $80B authorization and dividend: Q1 FY27 8-K, SEC
- Share-count history (decade view): Mastercard, Macrotrends; NVIDIA split-adjusted, Macrotrends; Salesforce, financecharts; Amazon per its 10-K FY2025, SEC. Figures are approximate and rounded; NVIDIA is split-adjusted for the June 2024 10-for-1 split.
This article is for informational purposes only and is not investment advice. Company figures are drawn from the filings and disclosures linked above; verify current data before acting.